07/03/2025

Over the last couple of years and in sharp contrast to the rest of the period since the Global Financial Crisis (GFC), investors have been enjoying attractive yields in fixed-income markets. The normalisation of interest rates after more than a decade near zero has brought investors back into the market, but this in turn is leading to more competitive all-in yields across the credit curve – that is to say that the premium over risk-free rates has been coming down.
THE SIGNIFICANCE OF CREDIT SPREADS
Assessing relative value in credit markets requires looking beyond absolute yields. For any asset with credit risk—essentially, anything outside of developed market sovereign debt—the key metric is the credit spread over a benchmark rate, which reveals the additional compensation for assuming credit risk. Typical benchmarks are sovereign debt (e.g., Gilts, Bunds) or swap rates, which are market-based measures of interest rate expectations over different horizons.
A lower credit spread implies (but doesn’t guarantee) a lower credit risk. This relationship is evident when comparing indices tracking corporate credit spreads at different risk levels—for example, Investment Grade (IG) versus sub-Investment Grade (sub-IG) bonds. IG bonds are issued by entities with a strong ability to repay debt, and carry ratings from the main rating agencies (Moody’s, S&P, Fitch) of between AAA and BBB-. Sub-IG bonds, also referred to as High Yield (HY), are issued by entities with a higher risk of default, with ratings ranging between BB+ and CCC-.
The below graph shows the 5-year Sterling Overnight Index Average (SONIA), a conventionally used benchmark rate, with the additional credit spread for IG and HY Euro bond indices (note, due to limited supply, there is no available index for Sterling bonds).
Historical Yield Breakdown
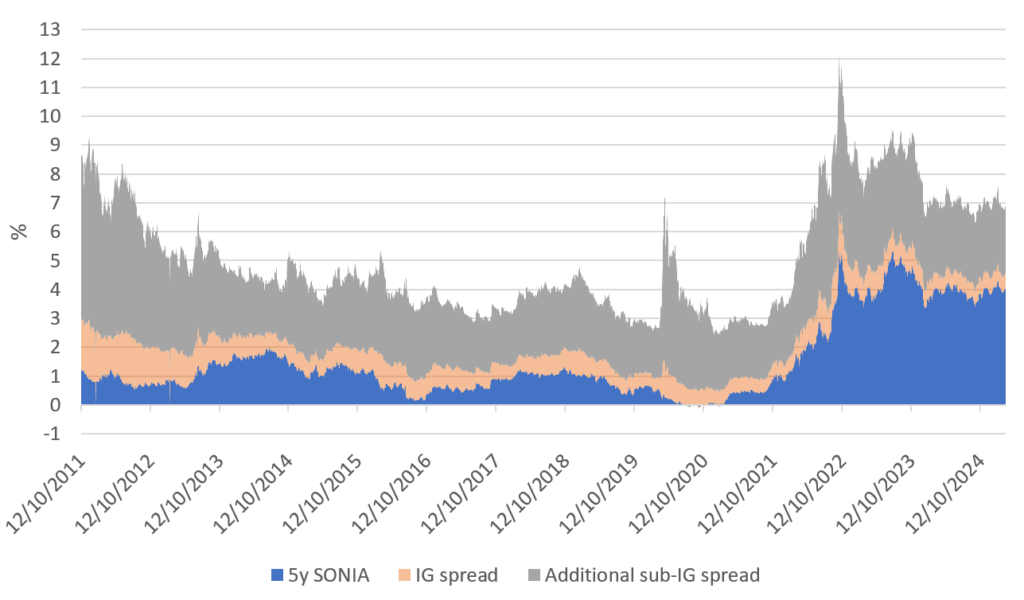
Despite all-in yields for HY credit being comparable today to early 2012 levels at around 6%, the composition of those yields has shifted. Back then, credit spreads were a much larger component due to higher perceived economic risk and lower base rates aimed at stimulating growth. Similarly, IG pays higher nominal yields today (c. 4% versus 3% in 2011), however, the spread component has gone from around 60% of the return to 11% today. This highlights an important feature of bond yields in the form of an in-built hedge (to an extent), whereby lower benchmark rates usually coincide with weaker economic growth and therefore wider spreads, and vice versa.
SPREAD TRAJECTORY
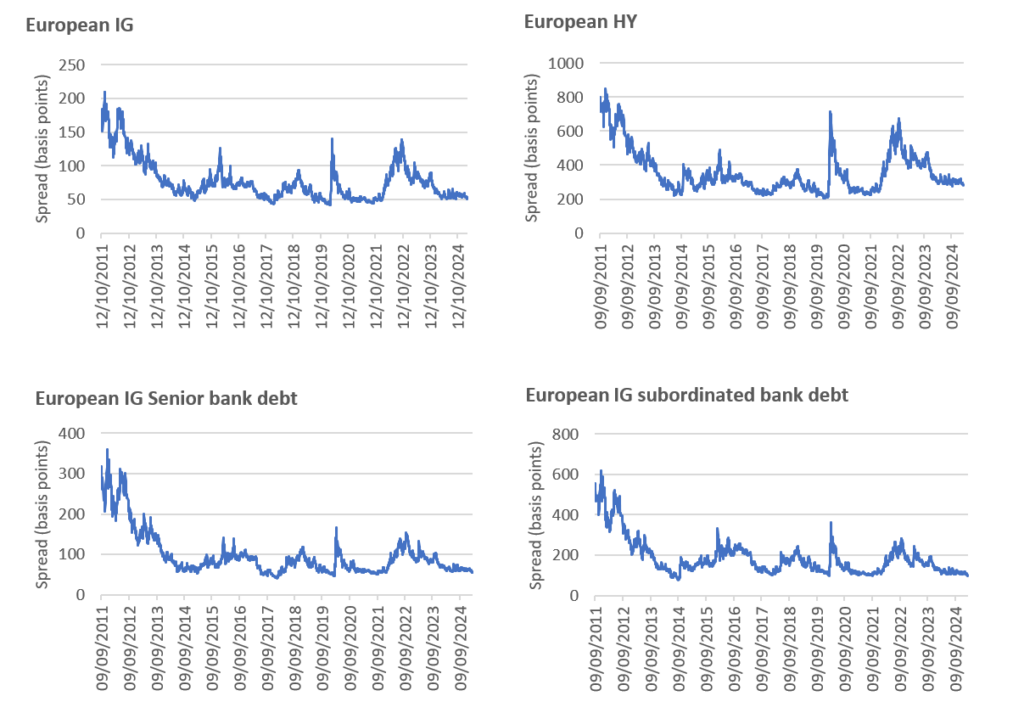
Today, credit spreads are near multi-year lows across many segments of the market.
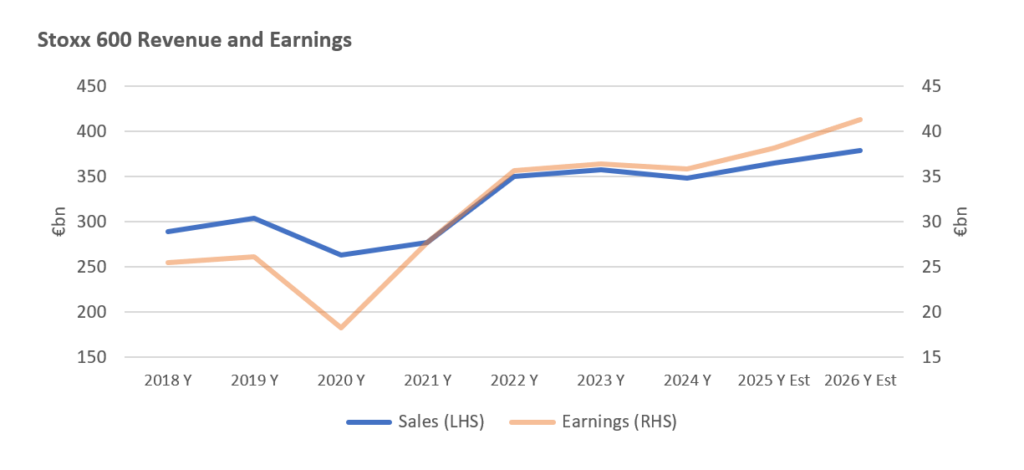
There are plenty of reasons to justify tighter spreads. Expectations of monetary easing by the ECB and Bank of England would lead to lower debt servicing costs, for example (however, recent inflationary pressures pose a risk to this outlook). Additionally, corporate fundamentals in Europe have been pretty resilient despite a turbulent few years, and earnings growth is expected to continue.
That said, GDP growth in the UK and Europe has been relatively tame in recent years, with geopolitics clouding the outlook and high energy prices and savings rates constraining consumption. Yet credit spreads on Euro bonds reflect a benign outlook.
Beyond fundamentals, technical factors are playing a role in keeping spreads tight. For one, the attractive all-in yields—among the highest in 15 years—are driving robust investor interest. Additionally, corporate bond supply in Europe has been subdued in the past two or three years, particularly lower down the credit curve.
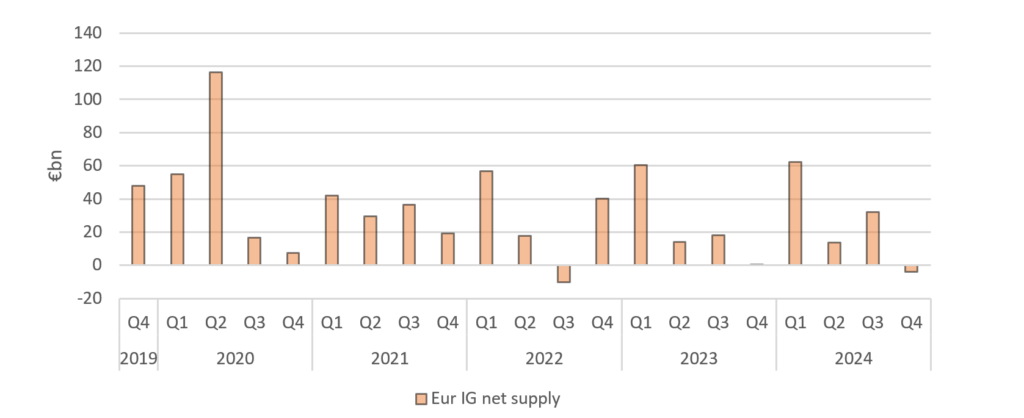
A huge refinancing wave that took place in 2020 and 2021 at rock-bottom interest rates allowed corporates to extend the maturity of debt at the same time as locking in low servicing requirements. Particularly for IG borrowers, this contributed towards strong cash positions that in some instances have been used to repay debt. Nevertheless, net supply in IG has still been robust, so spreads of around 50 basis points point to how strong demand is at the all-in yields.
EUR IG Net Supply
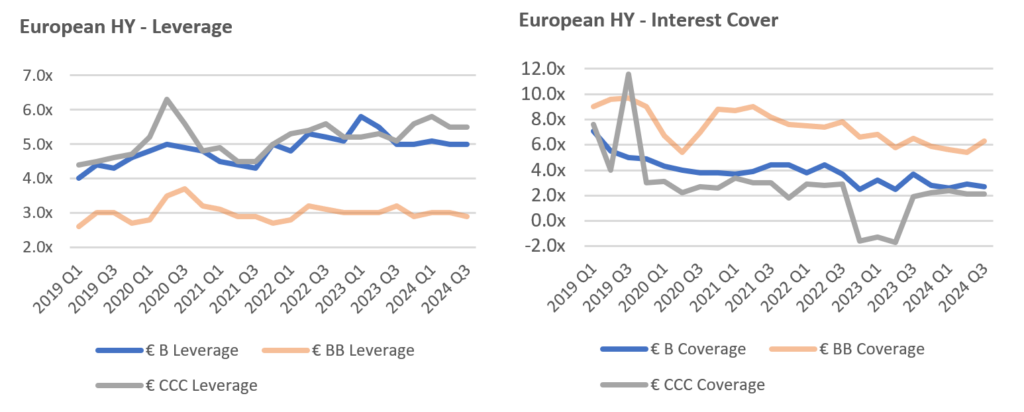
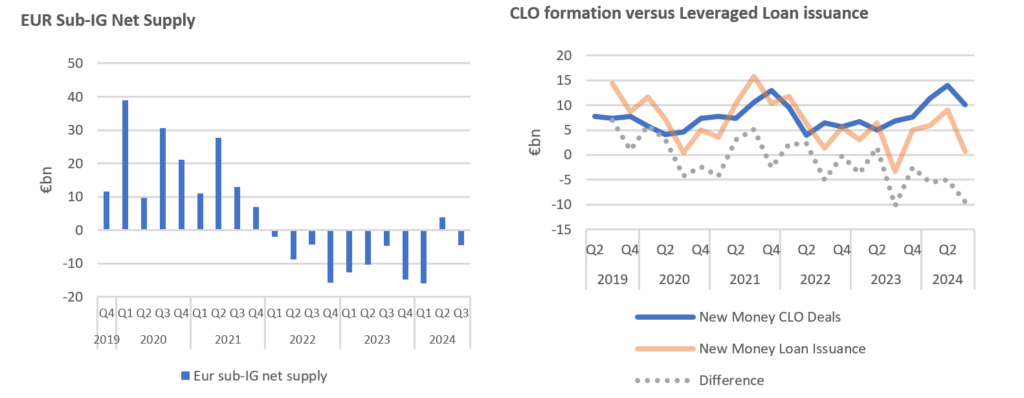
In HY, where private equity-driven leveraged buyouts (LBOs) are a key driver of supply, M&A activity has been drastically reduced in the face of higher financing costs, limiting new money (i.e., non-refinancing) transactions and causing net supply in the HY market to be largely negative over the past three years. At the same time as limited new supply, some existing stock of paper has been lost to the IG market (“rising stars”), the burgeoning private credit space, or repaid. On the demand side, formation of structured finance vehicles called collateralized loan obligation (CLOs) that are a key buyer of leveraged loans (a part of the sub-IG universe) has been strong, resulting in the demand/supply imbalance being squeezed at both ends.
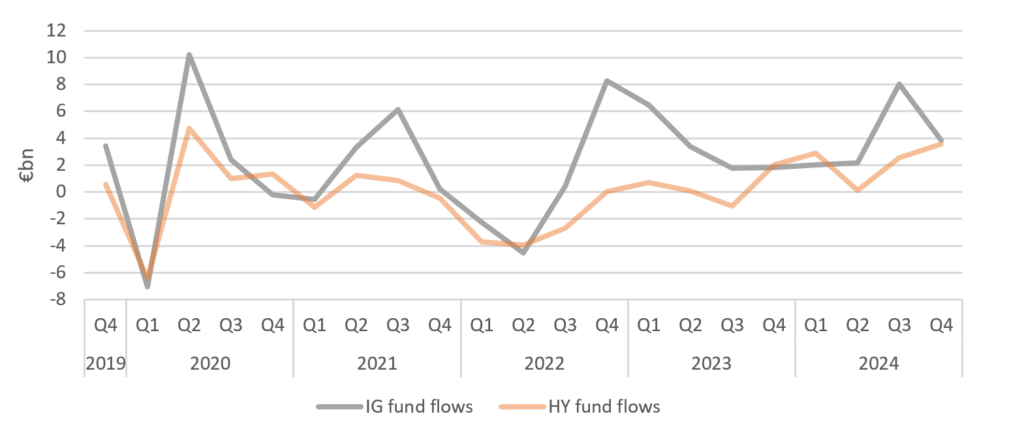
Fund flows are another proxy for demand, which again, points to a robust picture across the credit curve in Europe since rates increased during 2022.
EUR IG and sub-IG fund flows
ASSET-BACKED FINANCE (ABF) AND PRIVATE CREDIT
Similar dynamics are playing out in the public asset-backed finance (ABF) markets, where investors fund specific asset pools (e.g., residential mortgages, car leases, or corporate loans) through bankruptcy-remote special purpose vehicles (SPVs). Spreads in most asset classes have tightened in recent months, in many cases falling below historical averages since 2015.
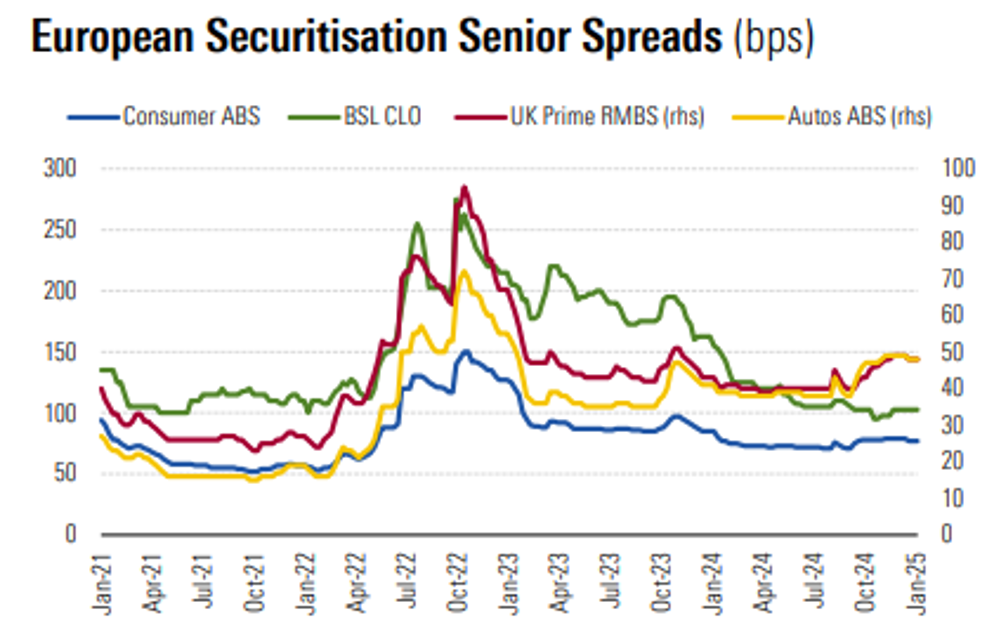
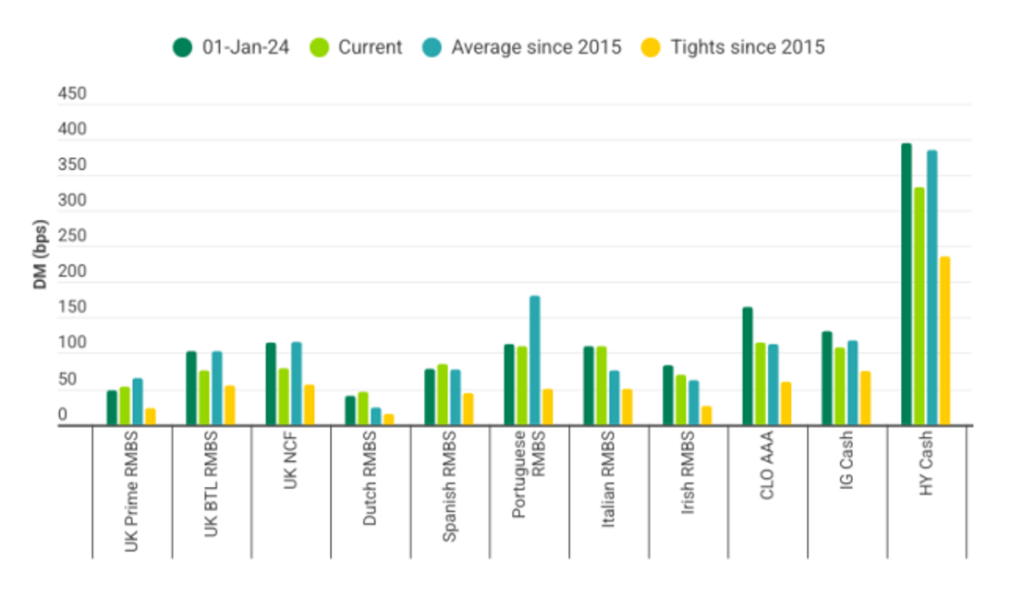
This can be justified by the fundamentals in some cases. For example, UK residential and buy-to-let mortgages remain resilient, supported by stable property prices, real wage growth, and rental inflation. Despite over £400bn in mortgage resets in 2023 and 2024 at higher rates, arrears have remained low.
Additionally, private credit—once limited to mid-market leveraged buyouts (LBOs)—now competes (and, more recently, collaborates) directly with banks and public markets across a broad range of financing opportunities, from corporate lending to aviation finance, and increasingly all manner of ABF (see here). According to estimates, the private credit market grew from $812 billion in 2019 to $2.1 trillion in 2023.
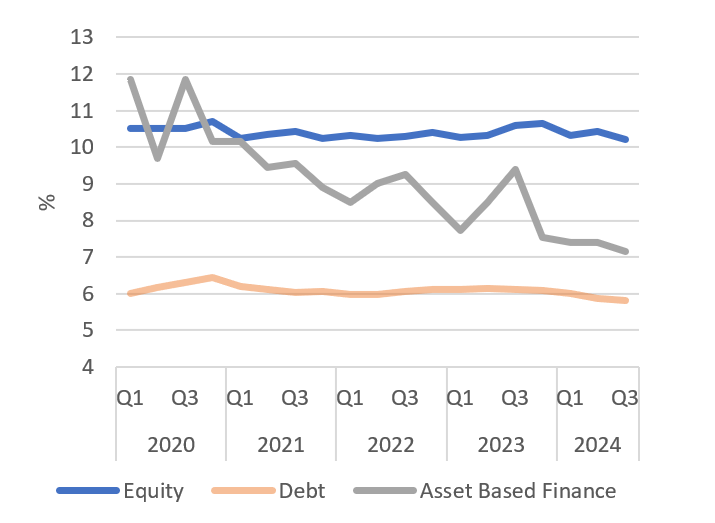
The insatiable private credit demand for ABF opportunities is evident when looking at business development companies (BDCs), which are a good proxy for private credit. BDCs are publicly traded investment vehicles that provide capital to parts of the market where traditional financing is scarce (e.g., venture capital or private credit). The BDC spread is the difference between what a BDC earns on its investments and the cost of funding. The graph below shows a dramatic spread reduction in the ABF space; of course this could be driven by lower returns or higher funding costs, however, the stability in the equity and debt BDC spreads suggests the lower ABF spreads are driven more by the former. This is also consistent to what we are seeing in the UK private ABF space, where demand and competition has increased in recent years.
European BDC Spreads
Another emerging trend we see anecdotal evidence of in the alternative lending sector is increasing competition from major financial institutions (e.g. UK clearing banks and US investment banks), which are offering cheaper cost of funds and higher advance rates on senior facilities, and are beginning to lower the minimum facility size at which they become interested. This competition is filtering down the capital structure, squeezing spreads even on mezzanine and subordinate debt.
CONCLUSION
As long as interest rates remain higher-for-longer, credit spreads are likely to stay tight. Some of this is self-reinforcing: high rates signal economic resilience, which supports tighter spreads.
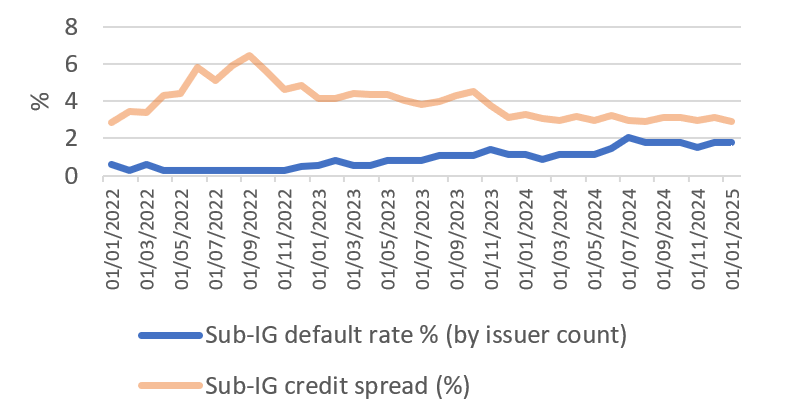
However, broader risks to growth remain. Moreover, technical factors such as supply-demand imbalances are contributing to spread compression, which grind tighter despite a modest uptick in corporate defaults (see below). Additionally, the influx of capital into private credit is adding to the supply-demand imbalance across different asset classes, further compressing spreads.
Sub-IG credit spread vs. default rates
A combination of resilient fundamentals and robust demand for assets with healthy yields is placing a ceiling on spreads, which can be expected during the latter stages of the credit cycle. With this in mind, sticking to higher-quality credit in the bond markets remains a prudent strategy.
That said, investors must accept that strong demand and tight spreads mean lower yields for the relative safety of higher-quality assets. Maintaining similar levels of yield to one or two years ago would require moving down the credit curve and allocating to lower-quality bonds that carry a higher risk of default. A focus on quality issuers and selective high-yield opportunities appears a good strategy in the current environment. A separate allocation can then be made to ABF and private credit where issue-specific credit spreads can be more attractive.